For the month of April 2024, paid guest occupancy in vacation rental homes was 44.7% compared to 47.7% in 2023 and 35% in 2019.
AVERAGE DAILY RATE (ADR)
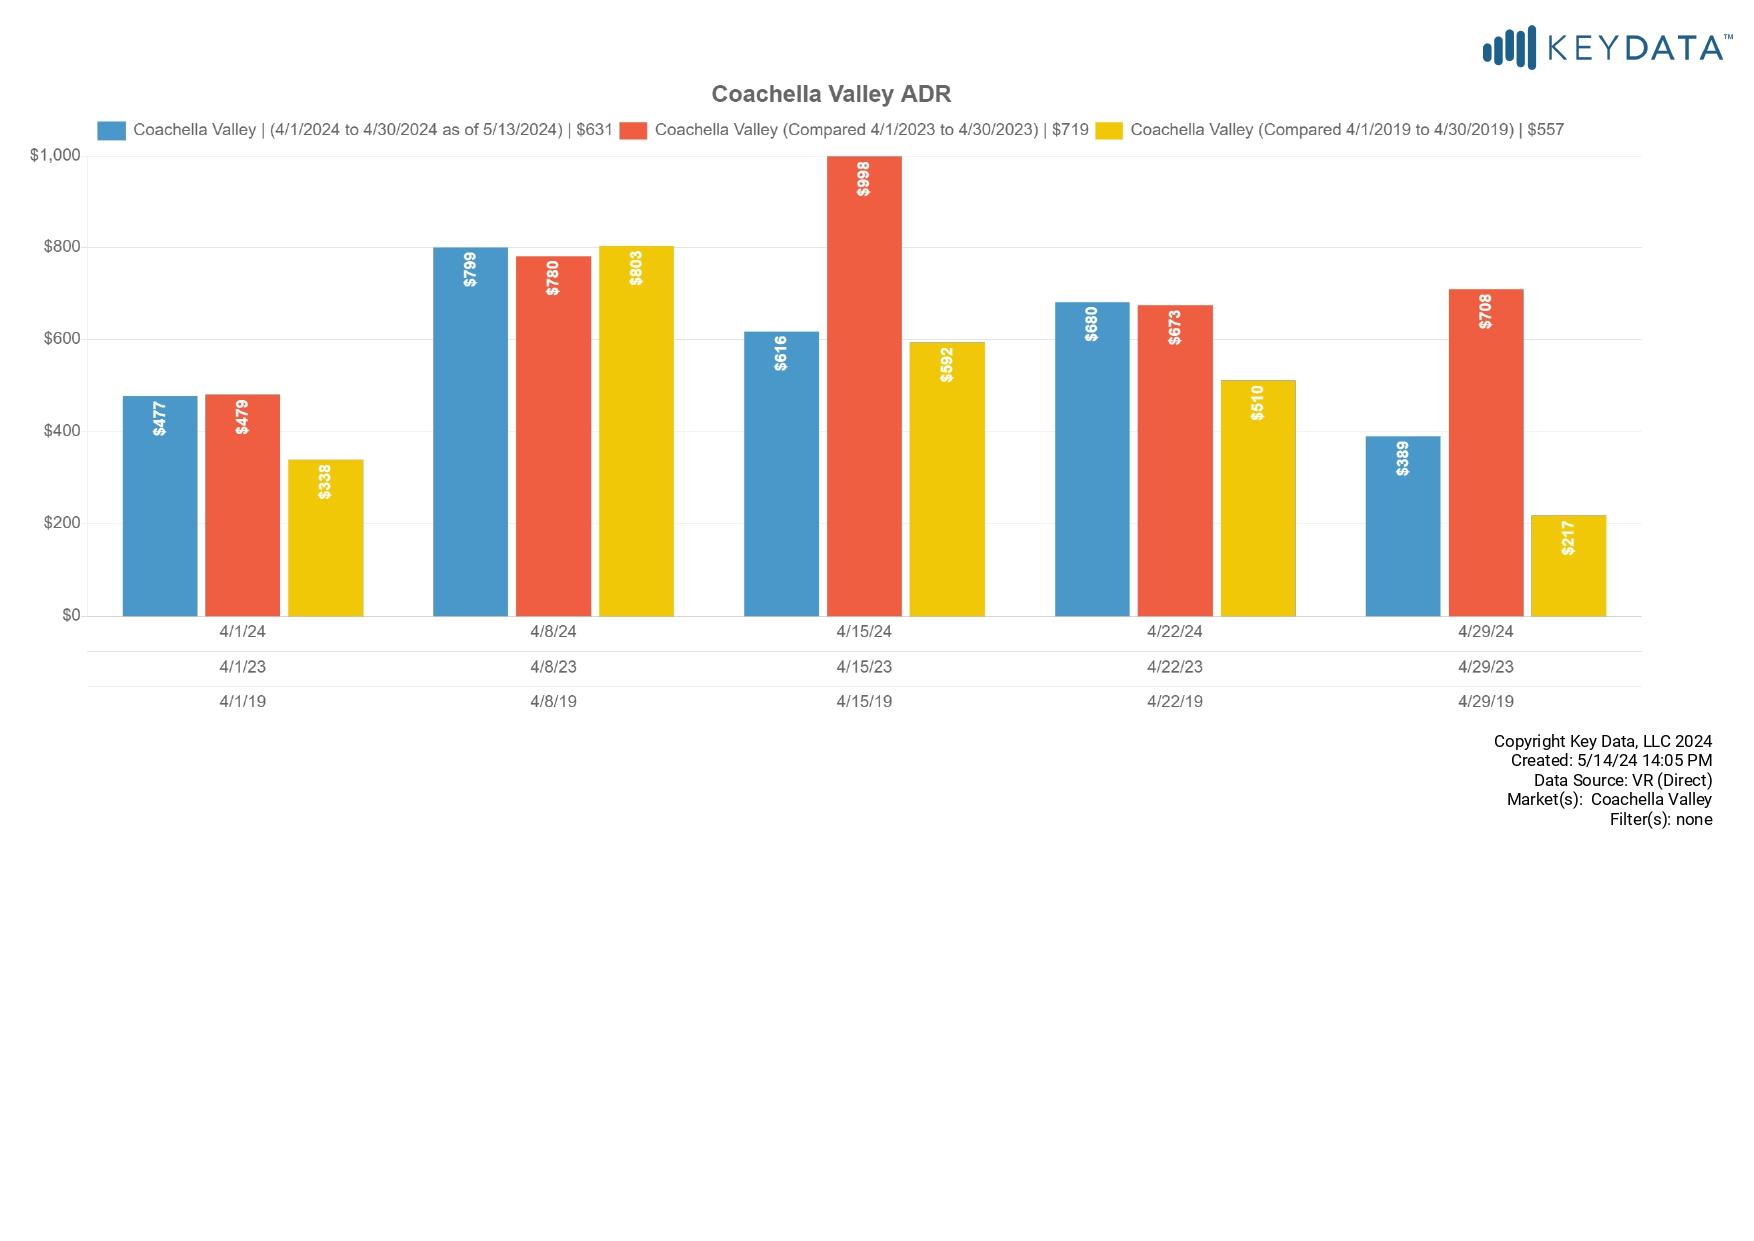
ADR for April of 2024 was $631 down from $719 in 2023, and up from $557 in 2019.
OTA OCCUPANCY
OTA calendar occupancy was 60.1% for April 2024, compared to 61.3% in 2023, and 43.7% in 2019. Note, the graph below also includes professionally managed “calendar occupancy” which includes dates occupied by owners, maintenance holds and other non-paid calendar blocks. OTA calendars do not indicate whether reservations are paid guest stays or non-paid calendar blocks.
March 2024
PROFESSIONALLY MANAGED HOMES
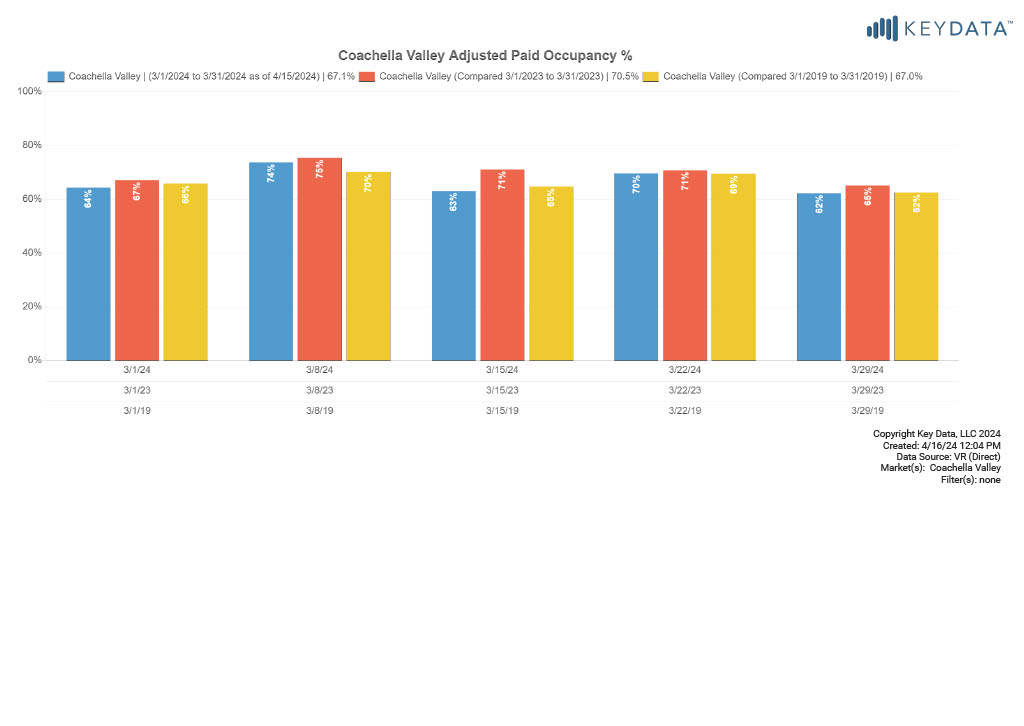
For the month of March 2024, paid guest occupancy in vacation rental homes was 67.1% compared to 70.5% in 2023 and 67.0% in 2019.
AVERAGE DAILY RATE (ADR)
ADR for March of 2024 was $453 up from $448 in 2023, and up from $299 in 2019.
OTA OCCUPANCY
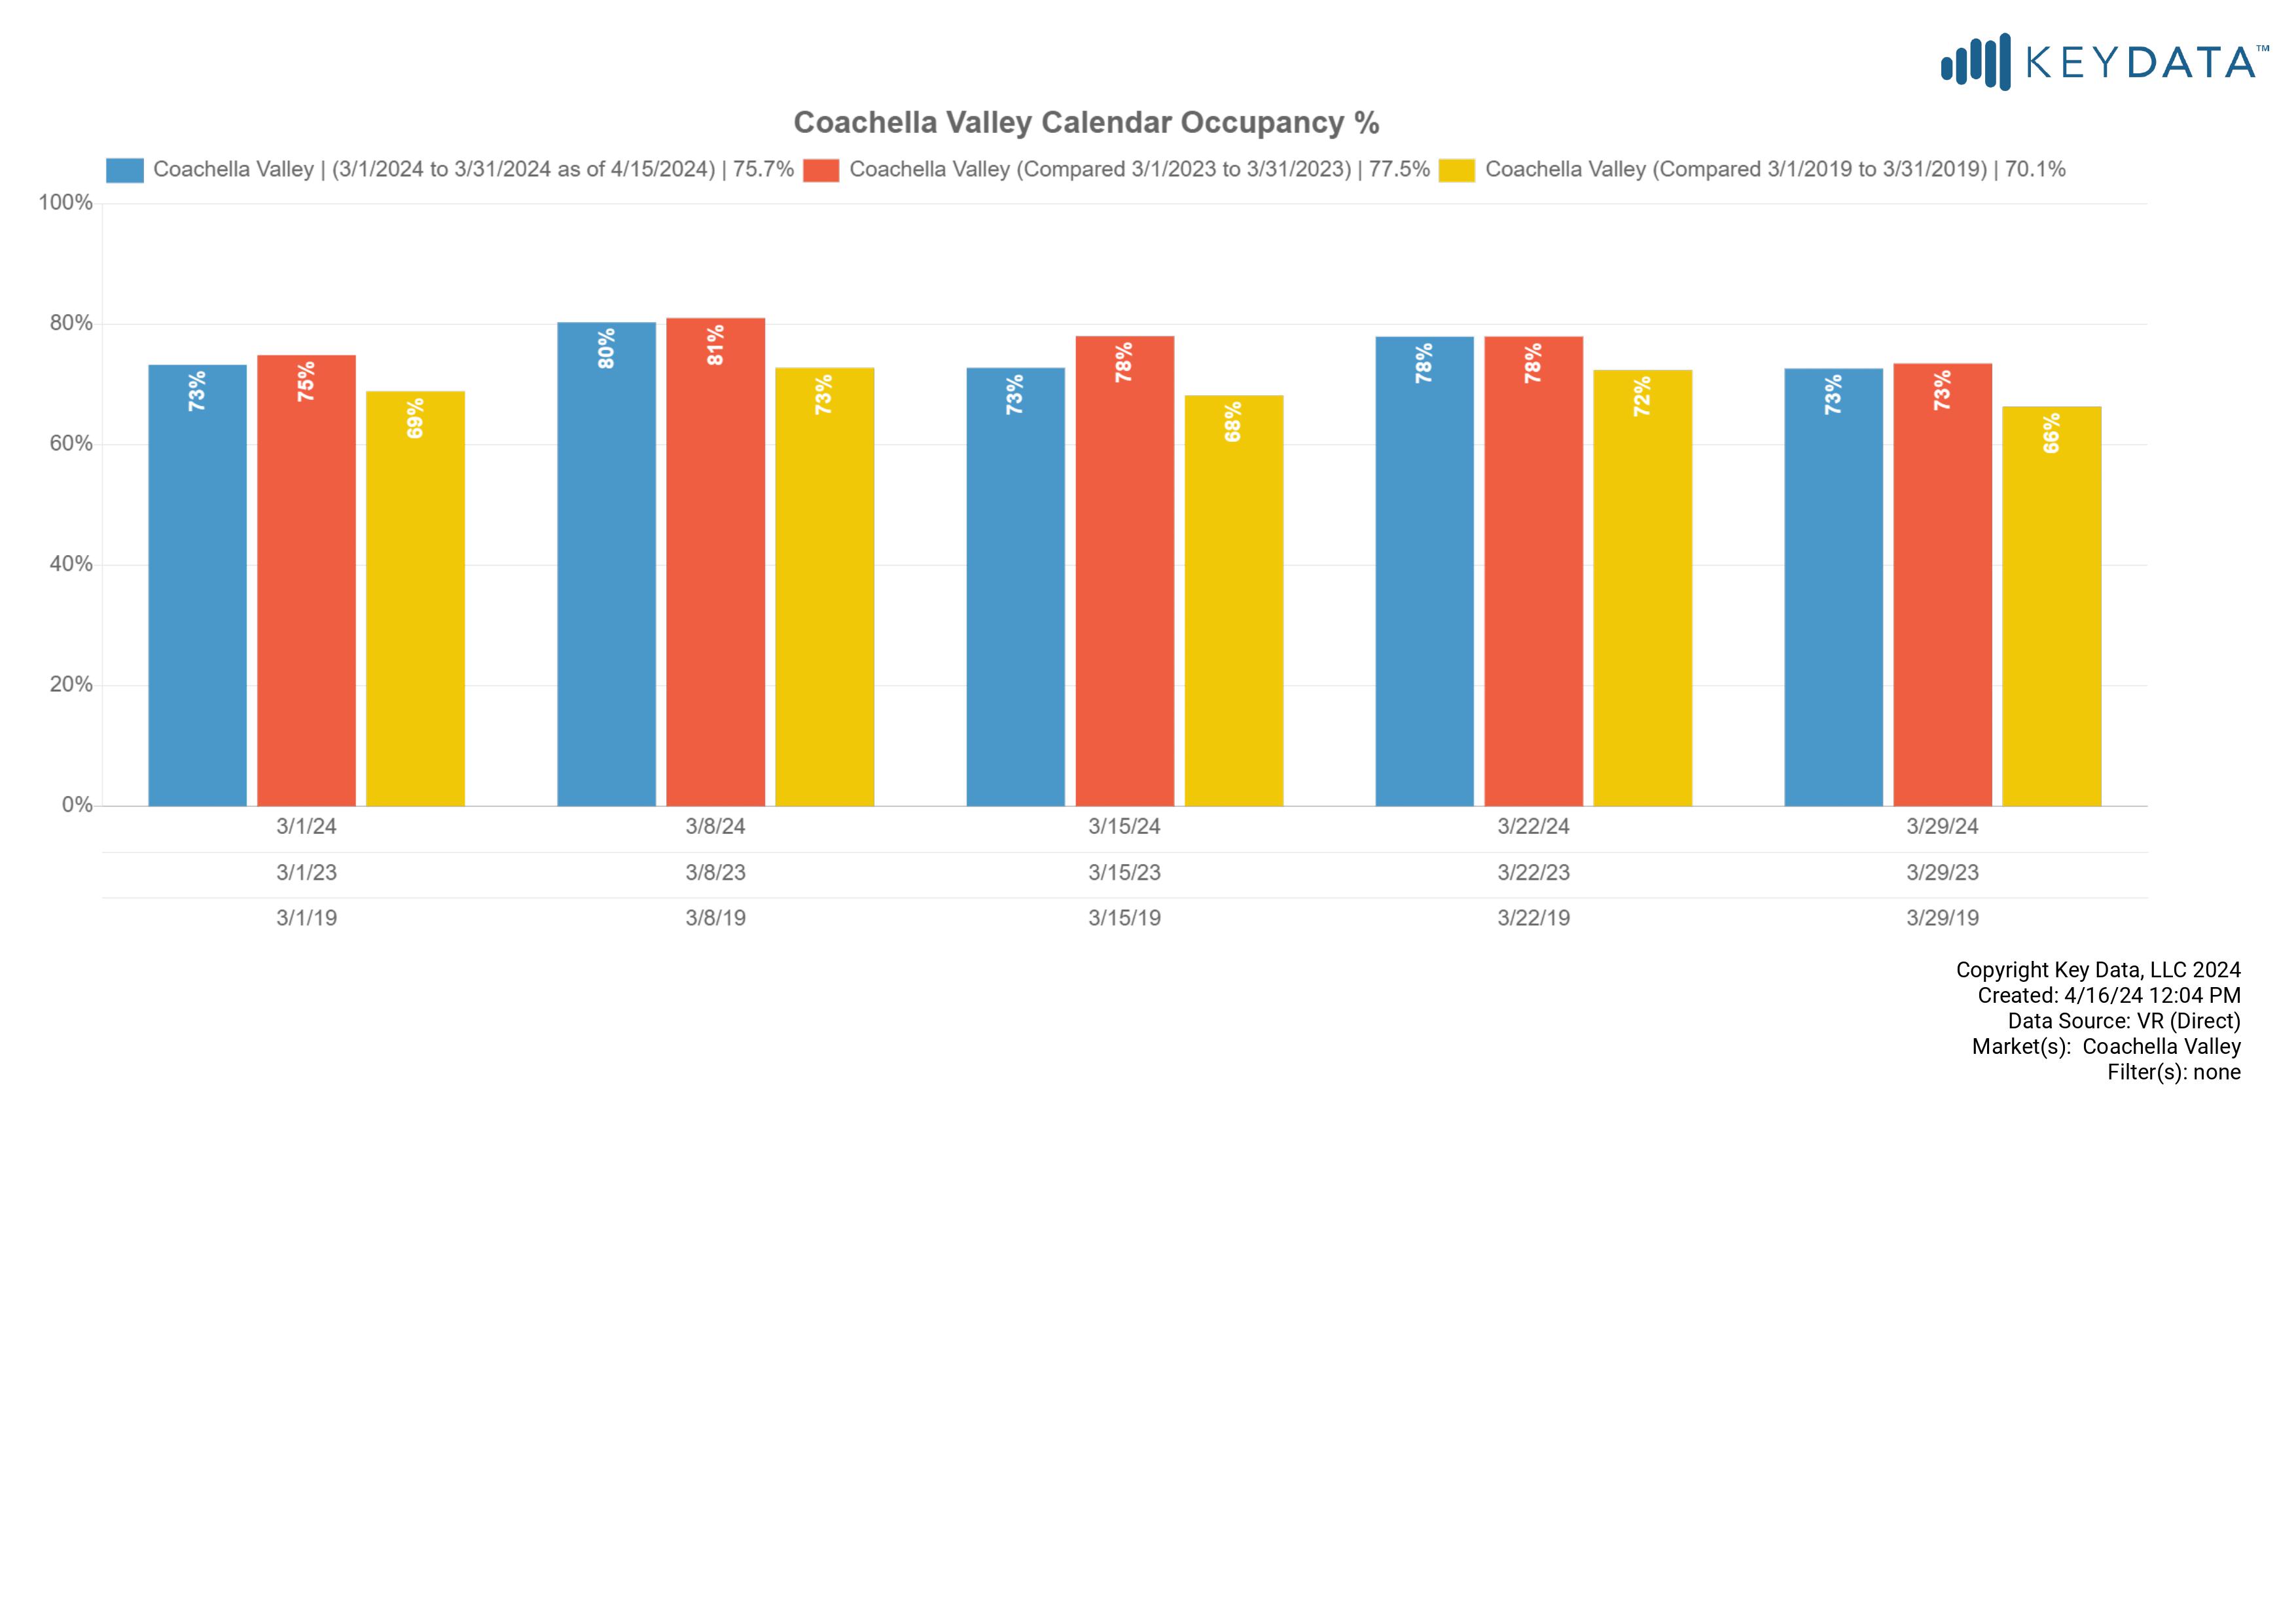
OTA calendar occupancy was 75.7% for March 2024, compared to 77.5% in 2023, and 70.1% in 2019. Note, the graph below also includes professionally managed “calendar occupancy” which includes dates occupied by owners, maintenance holds and other non-paid calendar blocks. OTA calendars do not indicate whether reservations are paid guest stays or non-paid calendar blocks.
February 2024
PROFESSIONALLY MANAGED HOMES
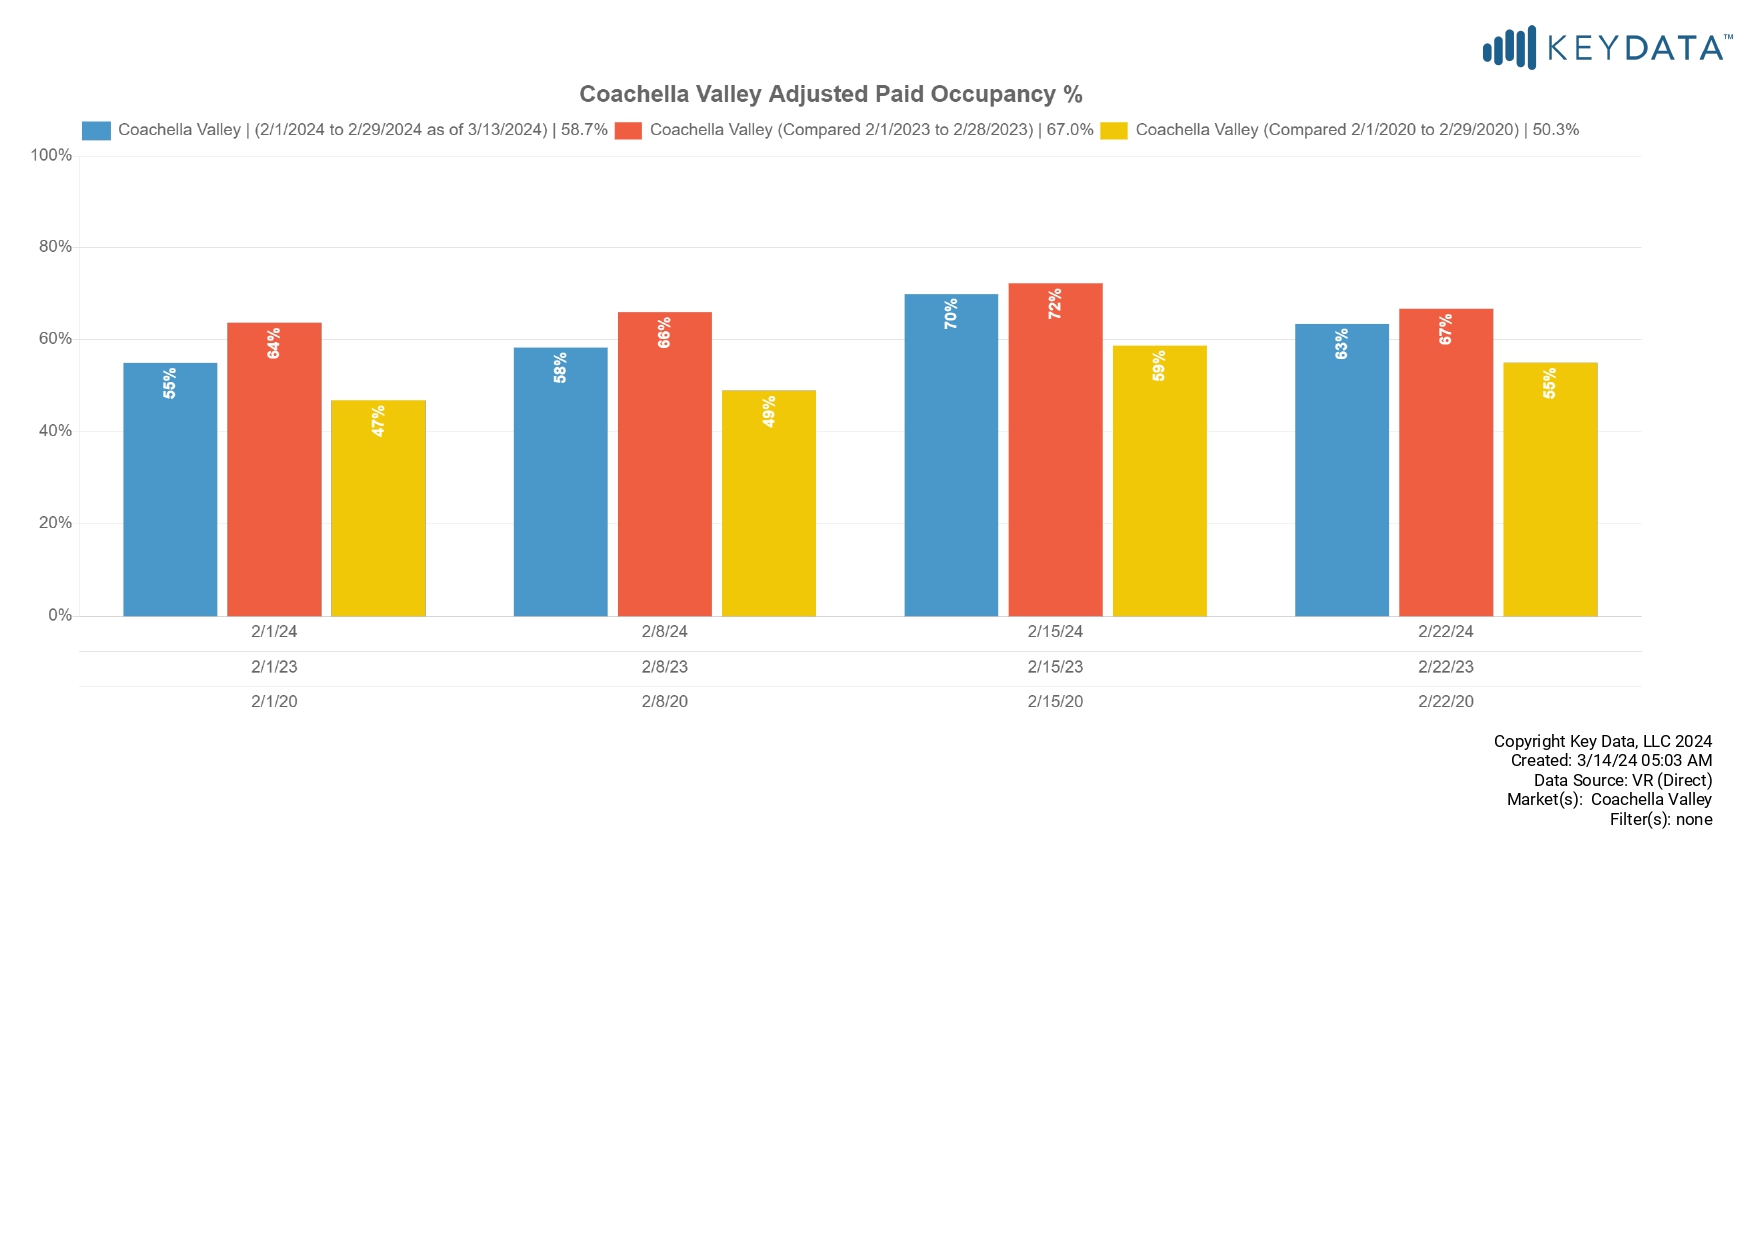
For the month of February 2024, paid guest occupancy in vacation rental homes was 58.7% compared to 67% in 2023 and 50.3% in 2020.
AVERAGE DAILY RATE (ADR)
ADR for February of 2024 was $369 down from $394 in 2023, and up from $265 in 2020.
OTA OCCUPANCY
OTA calendar occupancy was 69.1% for February 2024, compared to 73.9% in 2023, and 55.6% in 2020. Note, the graph below also includes professionally managed “calendar occupancy” which includes dates occupied by owners, maintenance holds and other non-paid calendar blocks. OTA calendars do not indicate whether reservations are paid guest stays or non-paid calendar blocks.
January 2024
PROFESSIONALLY MANAGED HOMES
For the month of January 2024, paid guest occupancy in vacation rental homes was 42.9% compared to 50.2% in 2023 and 35.1% in 2020.
Average Daily Rate (ADR)
ADR for January of 2024 was $329 slight down from $335 in 2023, and up from $242 in 2020.
OTA Occupancy
OTA calendar occupancy was 57.9% for January 2024, compared to 61.5% in 2023, and 43.6% in 2020. Note, the graph below also includes professionally managed “calendar occupancy” which includes dates occupied by owners, maintenance holds and other non-paid calendar blocks. OTA calendars do not indicate whether reservations are paid guest stays or non-paid calendar blocks.
December 2023
PROFESSIONALLY MANAGED HOMES
For the month of December 2023, paid guest occupancy in vacation rental homes was 29.6% compared to 34.3% in 2022 and 21.2% in 2019.
AVERAGE DAILY RATE (ADR)
ADR for December of 2023 was $428 down from $432 in 2022, and $361 in 2019.
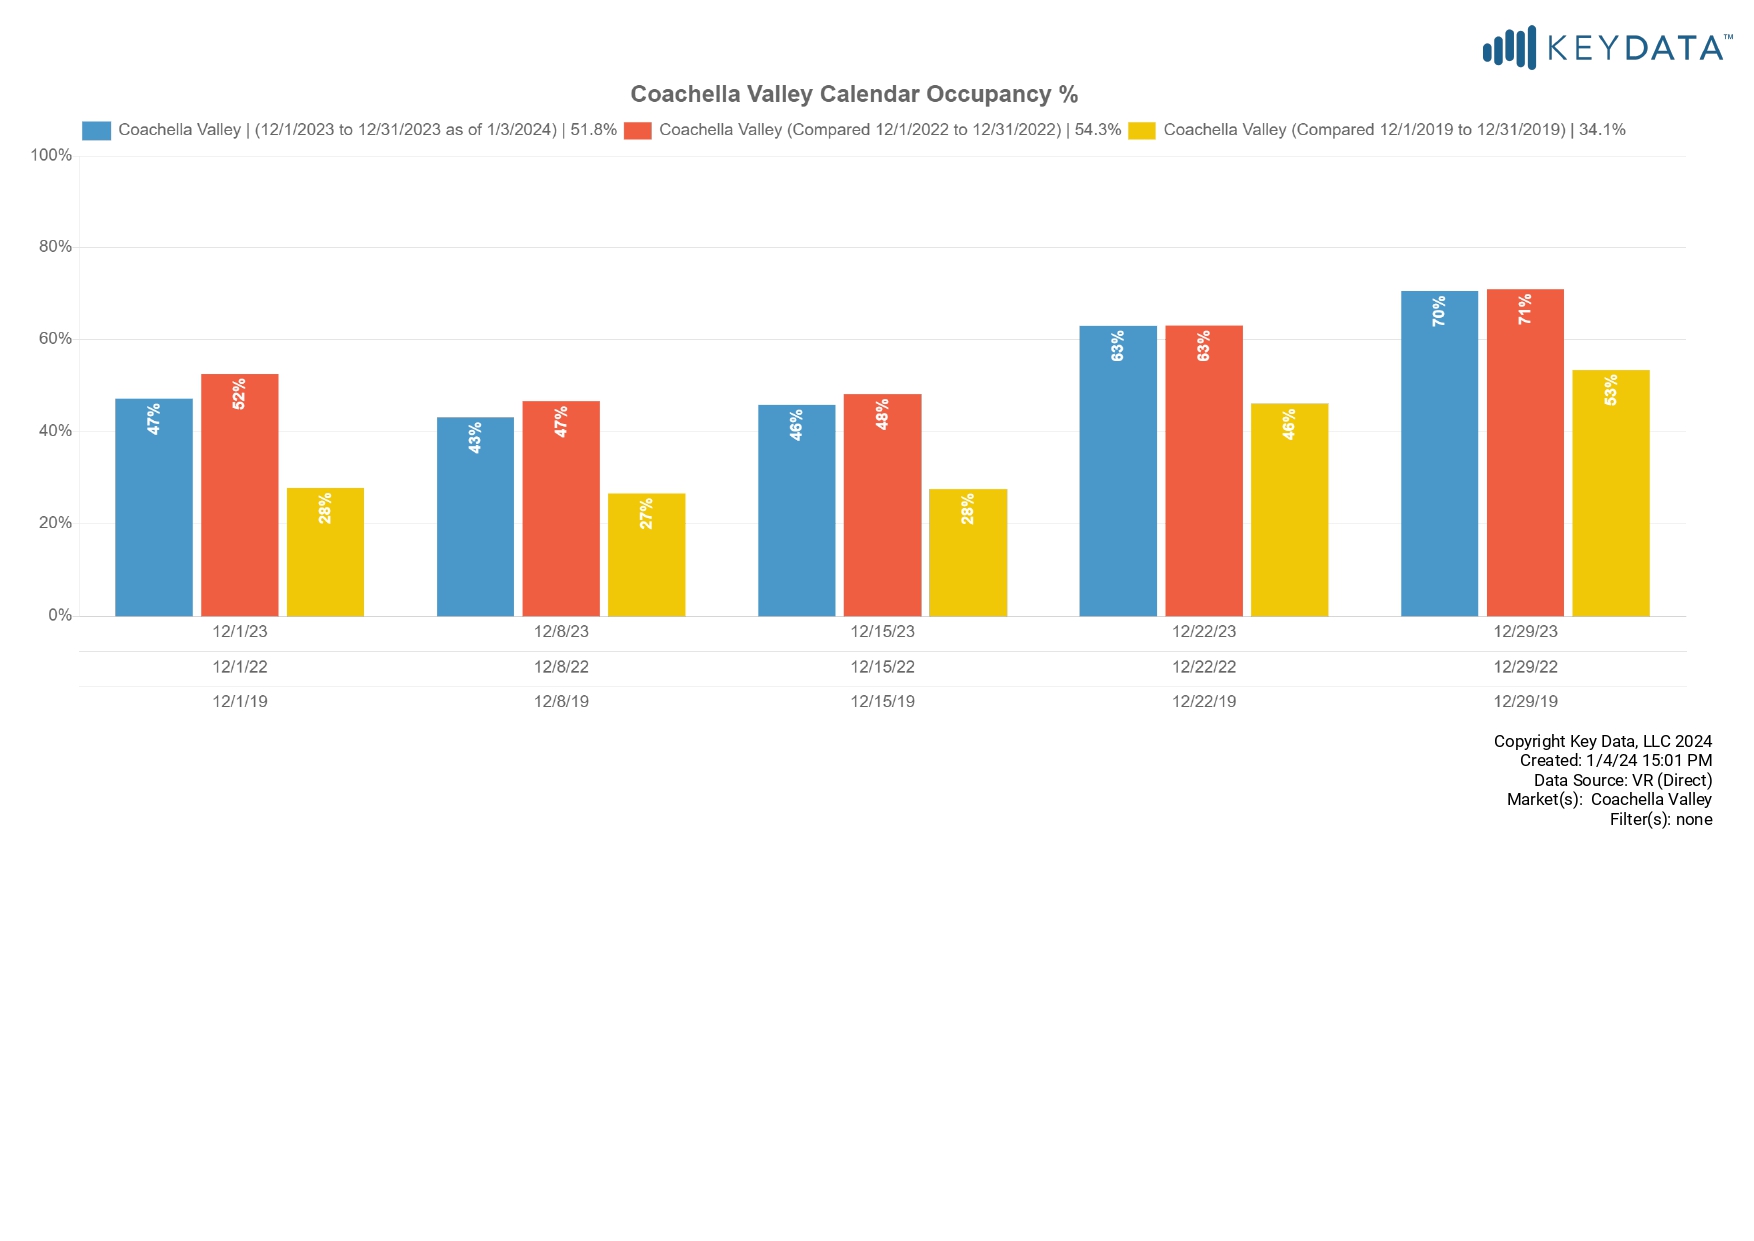
OTA OCCUPANCY
OTA calendar occupancy was 57.9% for January 2024, compared to 61.5% in 2023, and 43.6% in 2020. Note, the graph below also includes professionally managed “calendar occupancy” which includes dates occupied by owners, maintenance holds and other non-paid calendar blocks. OTA calendars do not indicate whether reservations are paid guest stays or non-paid calendar blocks.